Our analytics dashboard is designed to help you to understand what is going on with your google ads and, therefore, how you can make changes to marketing activity to increase conversions. This matches up with the website analytics dashboard to give a complete overview of what is happening on your site.
Here is an example google ads dashboard for what a typical dashboard will look like.
Here you can adjust the time period for which the website is being viewed.

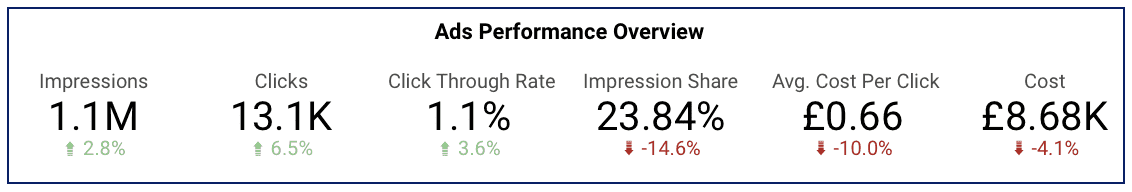
These stats allow you to see the following in clear numbers.
These numbers are based on the timescales within the top right and are compared to the previous period.
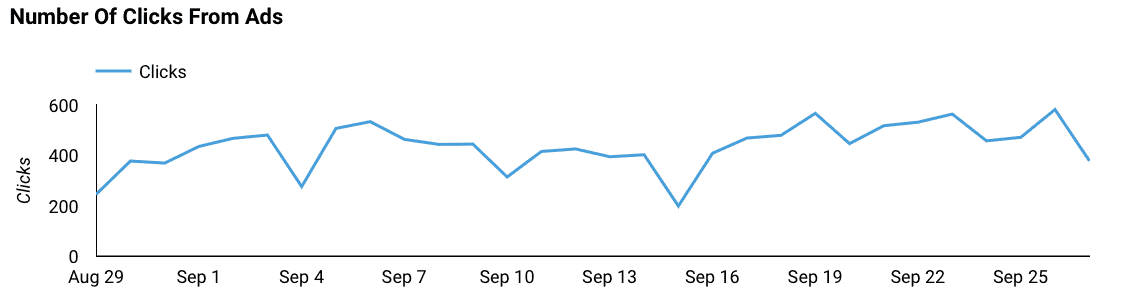
This is the graph of the number of people who have clicked on the ad and visited the landing pages within the time period set in the top right.
This is useful for understanding traffic patterns within the data. For example, less clicks on the weekend because there are fewer shoppers.
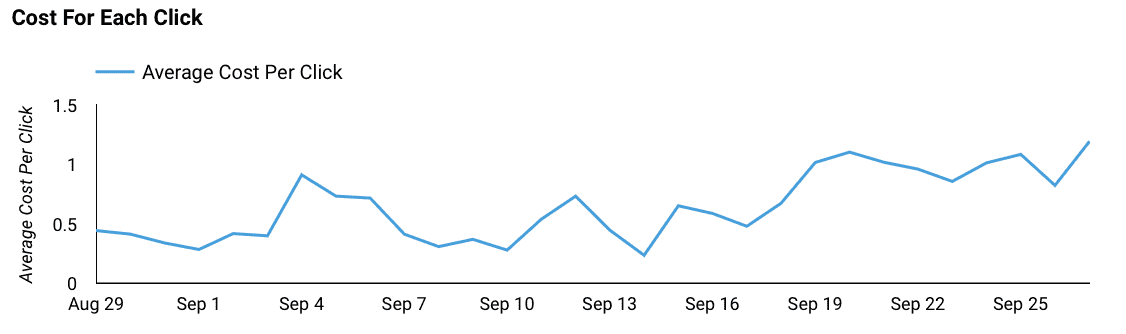
This is the graph of how much each click is costing you day by day within the time period set in the top right.
This should help you to see whether the ad is performing well or not.
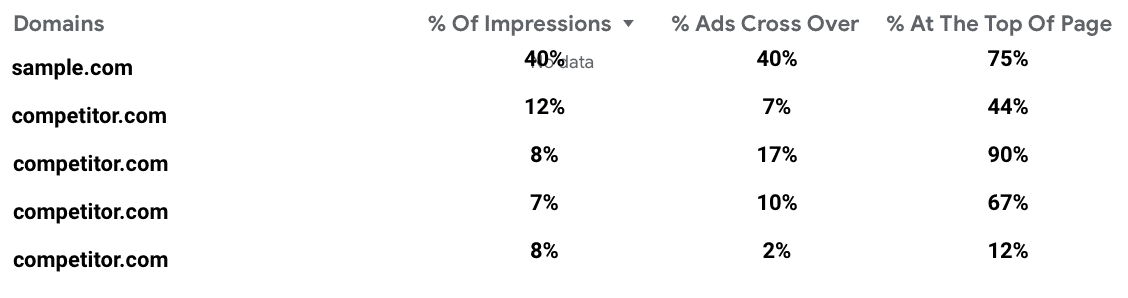
This table will allow you to see how your website compares to your competitors within the same subset of keywords you are targetting within the time period set in the top right.
Being able to see how well your ads are doing vs your competitors will allow you to benchmark your ads.
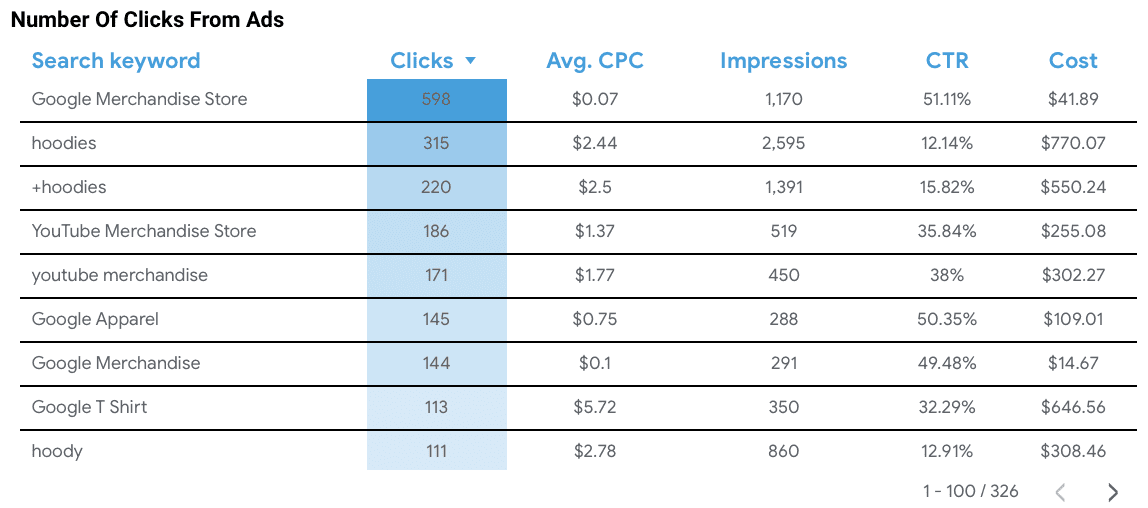
This data table allows you to see the individual performance of each keyword.
These numbers are dependant on the timescales set within the top right.